2015 Ridership Study Shows Some Growth and Some Room for Improvement
November 29, 2016
November 29, 2016
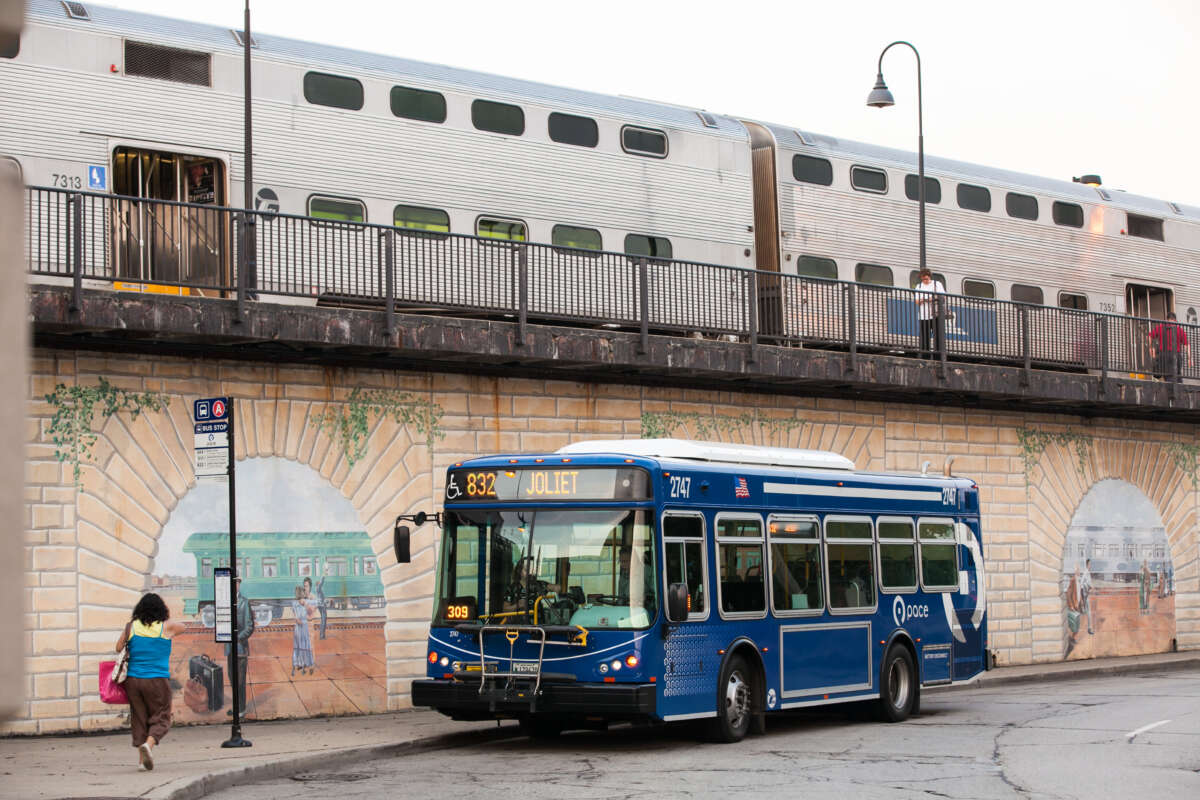
The RTA works with CTA, Metra, and Pace each year to perform a detailed analysis of system ridership trends in our region. The analysis examines ridership by mode and market area. The goal is to better understand how economic conditions and other factors such as new technology, service changes, capital investments, and fare increases impact ridership and what that means for the future of transit in our region. Check out the most recent annual ridership report on the RTA website. Let's take a look at what we found in the 2015 report.
How does ridership look in our region? You may have jumped for joy when you filled up at the pump lately, but in the transit world we are feeling the effect of the low gas prices. The RTA system provided 634.9 million passenger trips last year, down nearly 2 million trips from 2014. Despite decreased ridership, the RTA is encouraged by growth in key market segments. Growth in rail ridership and on express bus service illustrates that riders exceedingly value quick, efficient service.
Is cheap gas “driving” down ridership? There are a number of factors which contributed to fewer riders on the RTA system in 2015 and lower gas prices is one of them. Metra's fare increase and Pace’s elimination of cash transfers (for riders who have not switched to the Ventra card) also resulted in some loss of riders in 2015. You may be seeing more Divvy bikes in your neighborhood and Uber and Lyft drivers on the road. The popularity of these services may have contributed to some of the decline as well. However, we know these services help riders cover that first/last mile to/from transit that’s a challenge for public transportation throughout the country. A recent APTA study shows that ride and bike share users are actually more likely to use public transportation!
It seems to be getting more difficult to find a seat on my CTA train at certain times, so how can ridership be going down? Some areas of the system are seeing growth. CTA rail ridership now accounts for 47% of CTA ridership, up from 38% in 2008. That is a lot of riders! Ridership on the Blue Line increased 4% in 2015 to 46.8 million station entries. No surprise O’Hare is the busiest station on the Blue Line. The Red, Pink, Purple, Green, and Orange lines recorded at or above 2% ridership growth last year. The Red Line is the CTA’s most popular rail line with 78.8 million station entries tallied in 2015. CTA bus ridership dropped in 2015 but not in every market. South Side bus routes which feed into the CTA Red Line and Metra stations recorded strong ridership growth. Buses which travel from South Side neighborhoods to Downtown also performed well, as did buses going to Midway Airport.
How does ridership on my Metra line compare to others? Though overall Metra ridership was down a bit last year, rush hour ridership was up. With the low gas prices and the fare increase, some off-peak and weekend riders may have elected to drive or take other forms of transportation. Metra’s largest ridership base is in the northern and western suburbs. The BNSF line and the Union Pacific Northwest line (UP-NW) carry the most riders daily. In contrast, the North Central Service (NCS) line which travels to Antioch has the least frequent service and lowest ridership. Metra Electric riders, you may have noticed more empty seats in recent years. Still, nine million trips were recorded on Metra Electric trains last year.
How did Pace ridership look last year? Pace ridership declined last year, but there was growth on express bus service, particularly express service along the I-55 Stevenson Expressway. Bus routes that feed into CTA’s 95th Street Terminal were also an area of growth for Pace along with express routes that connect the Southwest Suburbs to the CTA’s Blue Line and to Pace’s Northwest Transportation Center in the City of Schaumburg. Buses in Pace’s South and West Divisions carry the most riders, recording 6 and 7 million trips in 2015, respectively. ADA Paratransit ridership increased in 2015 but at a slower rate than in past years.
Overall, as we look at this data, we want to continue to provide a regional service that we all can use regularly, and is a key to our region's life and economy. Ride On.
Subscribe to our Newsletter
Related Articles
 RTA celebrates 30 years of the Americans with Disabilities Act
This month the RTA is celebrating the 30th anniversary of the Americans with Disabilities Act (ADA). The ADA transformed society and provided opportunities f...
July 29, 2020 Take a survey to help improve mobility options for older adults and people with disabilities
Do you or someone you know face transportation challenges? The Regional Transportation Authority (RTA) wants to hear from you about transportation issues and...
May 7, 2020 Transportation Tuesday Webinar Series: Attend the 2020 RTA Annual Planning Workshop Virtually
The RTA is launching a four-part webinar series in place of the Annual Planning Workshop due to the ongoing COVID-19 pandemic. The free, virtual sessions wil...
April 17, 2020 Announcing the 2020 Access to Transit Program Call for Projects for Small-Scale Capital Projects
We are excited to announce that the call for projects for the RTA Access to Transit Program is now open. The RTA launched the Access to Transit program in 2...
March 13, 2020 Happy International Women’s Day and Women’s History Month from the RTA
Each year the RTA celebrates Women’s History Month in March to recognize the women who work at, and ride, CTA, Metra, and Pace every day. The celebration coi...
March 8, 2020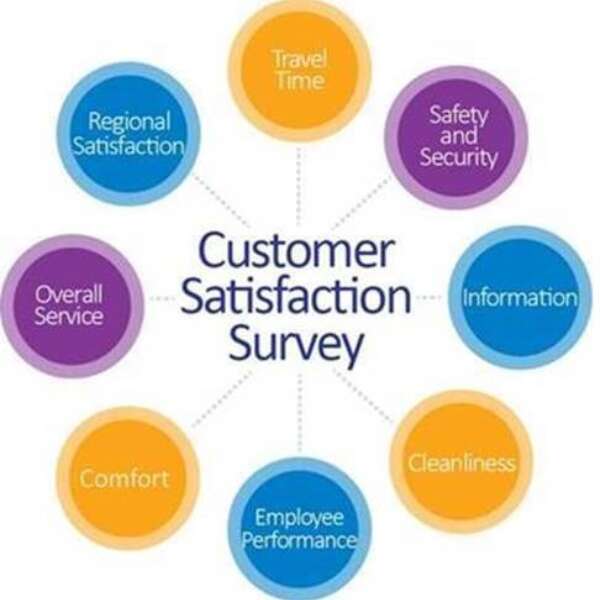 How's Your Ride? Take This Survey
We’d like to hear your thoughts about public transit! The RTA is sponsoring a system-wide customer satisfaction survey and would like your feedback about yo...
March 2, 2020